Open-Source Fire Science
Open-Source Fire Science
Coen, J. L. and W. Schroeder, 2017: Coupled Weather-Fire Modeling: from Research to Operational Forecasting. Fire Management Today. 75:39-45.
On June 30, 2013, 19 firefighters were killed during the Yarnell Hill fire, when a gust front from the northeast blew across the fire, changing its direction, and making it spread rapidly across where they were sheltered.
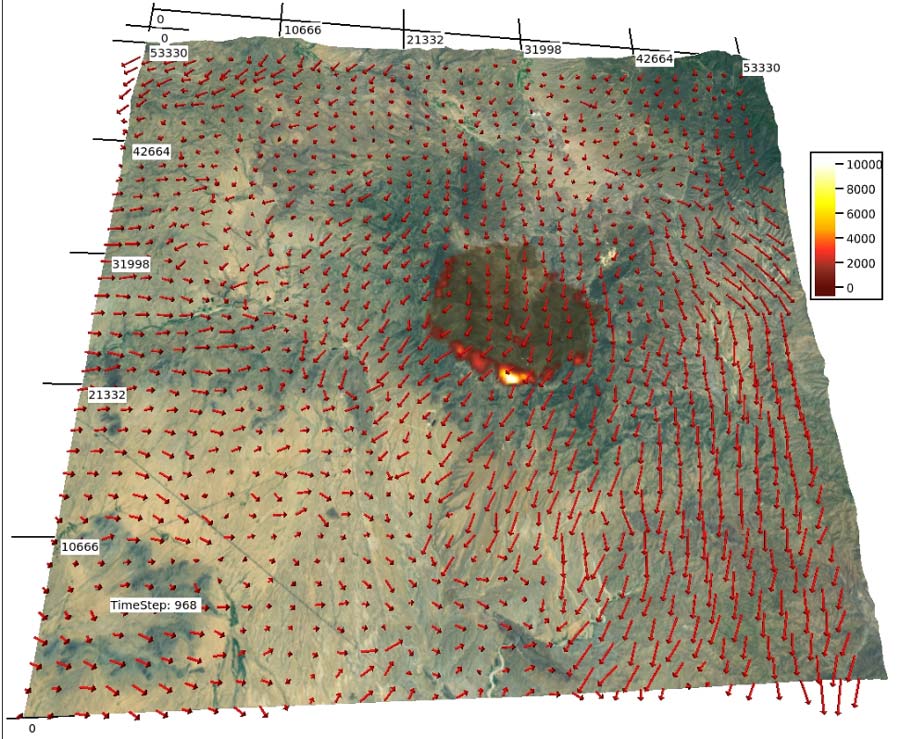
The animation depicts a CAWFE simulation of June 30 (370 m horizontal grid spacing), from 2 am – 8:15 PM local time. The fire is initialized in the model using the 3 AM VIIRS active fire detection map. Each frame is 1 minute apart. In the simulation, solar heating stirs up the boundary layer circulations throughout the day. Convection occurs in outer domains (not shown) to the northeast (upper right), creating high-based convective clouds as upper level air flows southeast over the Mogollon Rim. Rain falls into a very dry boundary layer, creating a broad gust front that reaches the south edge of the fire at frame 936. The fatality occurred around 4:45 PM. Comparison with the fatality report suggest the simulated timing for the gust front reaching the northeast edge of the fire and the fatality site are within 15 minutes of occurrence.