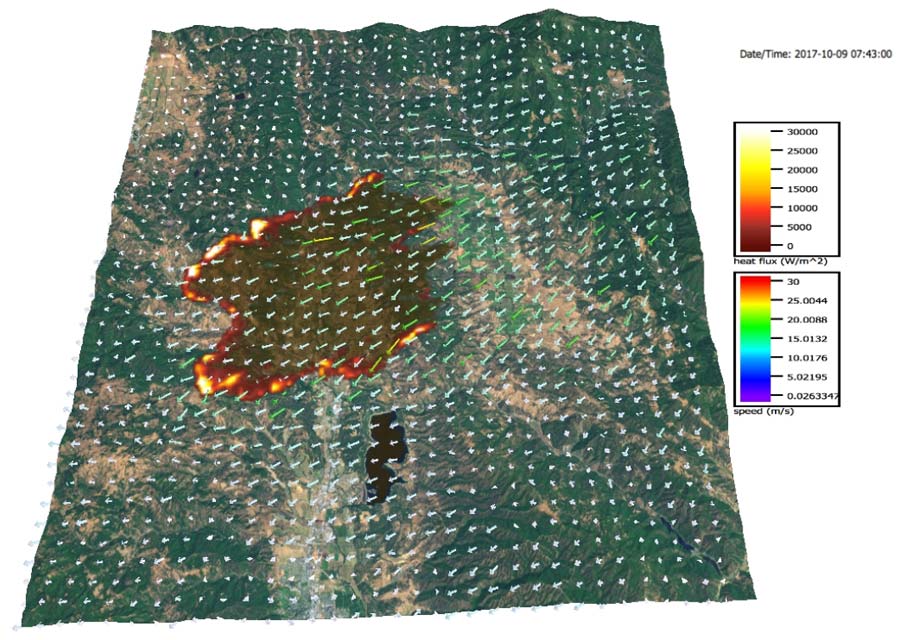
On October 8-9, 2017, fourteen large wildfires developed rapidly during a strong Diablo wind event in northern California including the Redwood Valley Fire. Diablo winds travelled south down the Sacramento Valley. The flow was pushed through gaps between ridges, creating narrow rivers of strong winds the peaks of which reached 30-40 m s-1 amidst areas where winds were weak or stagnant.
The Redwood Valley Fire had two nearby ignitions on the west side of the Potter Valley (the grass green area in center of Fig. R1). Driven by a shallow river of strong winds, within hours, it crested a ridge and raced down through populated lots into the Redwood Valley.