Coen, J. L., W. Schroeder, and B. Quayle, 2018: The generation and forecast of extreme winds during the origin and progression of the 2017 Tubbs Fire. Atmosphere, 9, 462. PDF
Here, we applied CAWFE to investigate the flow regime and underlying mechanisms associated with the extreme winds and fire behavior during the Tubbs Fire.
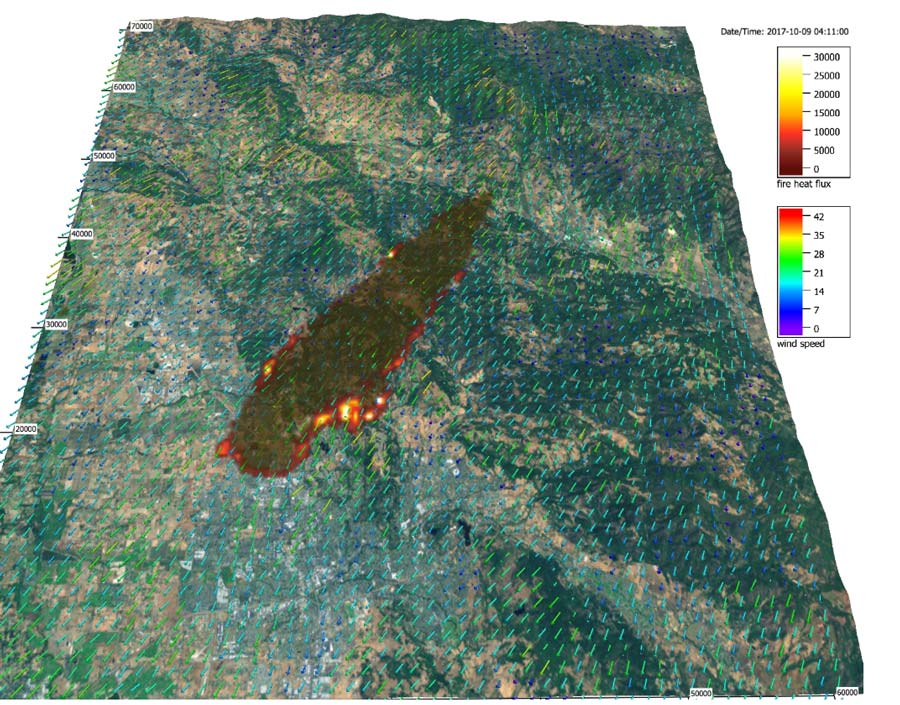
As Diablo winds travelled south down the Sacramento Valley and fanned out southwestward over Wine Country, their strength waxed and waned and their direction wavered, creating varying locations near fire origins where wind overrunning topography reached 30-40 m s-1. The flow created peak wind speeds exceeding 40 m s-1 at the crest of some lesser hills. The flow drove the Tubbs Fire over 19 km in 3.25 h into urban areas of Santa Rosa, CA.